


Title Page
-
Conducted on
-
Prepared by
OBSERVATIONS
-
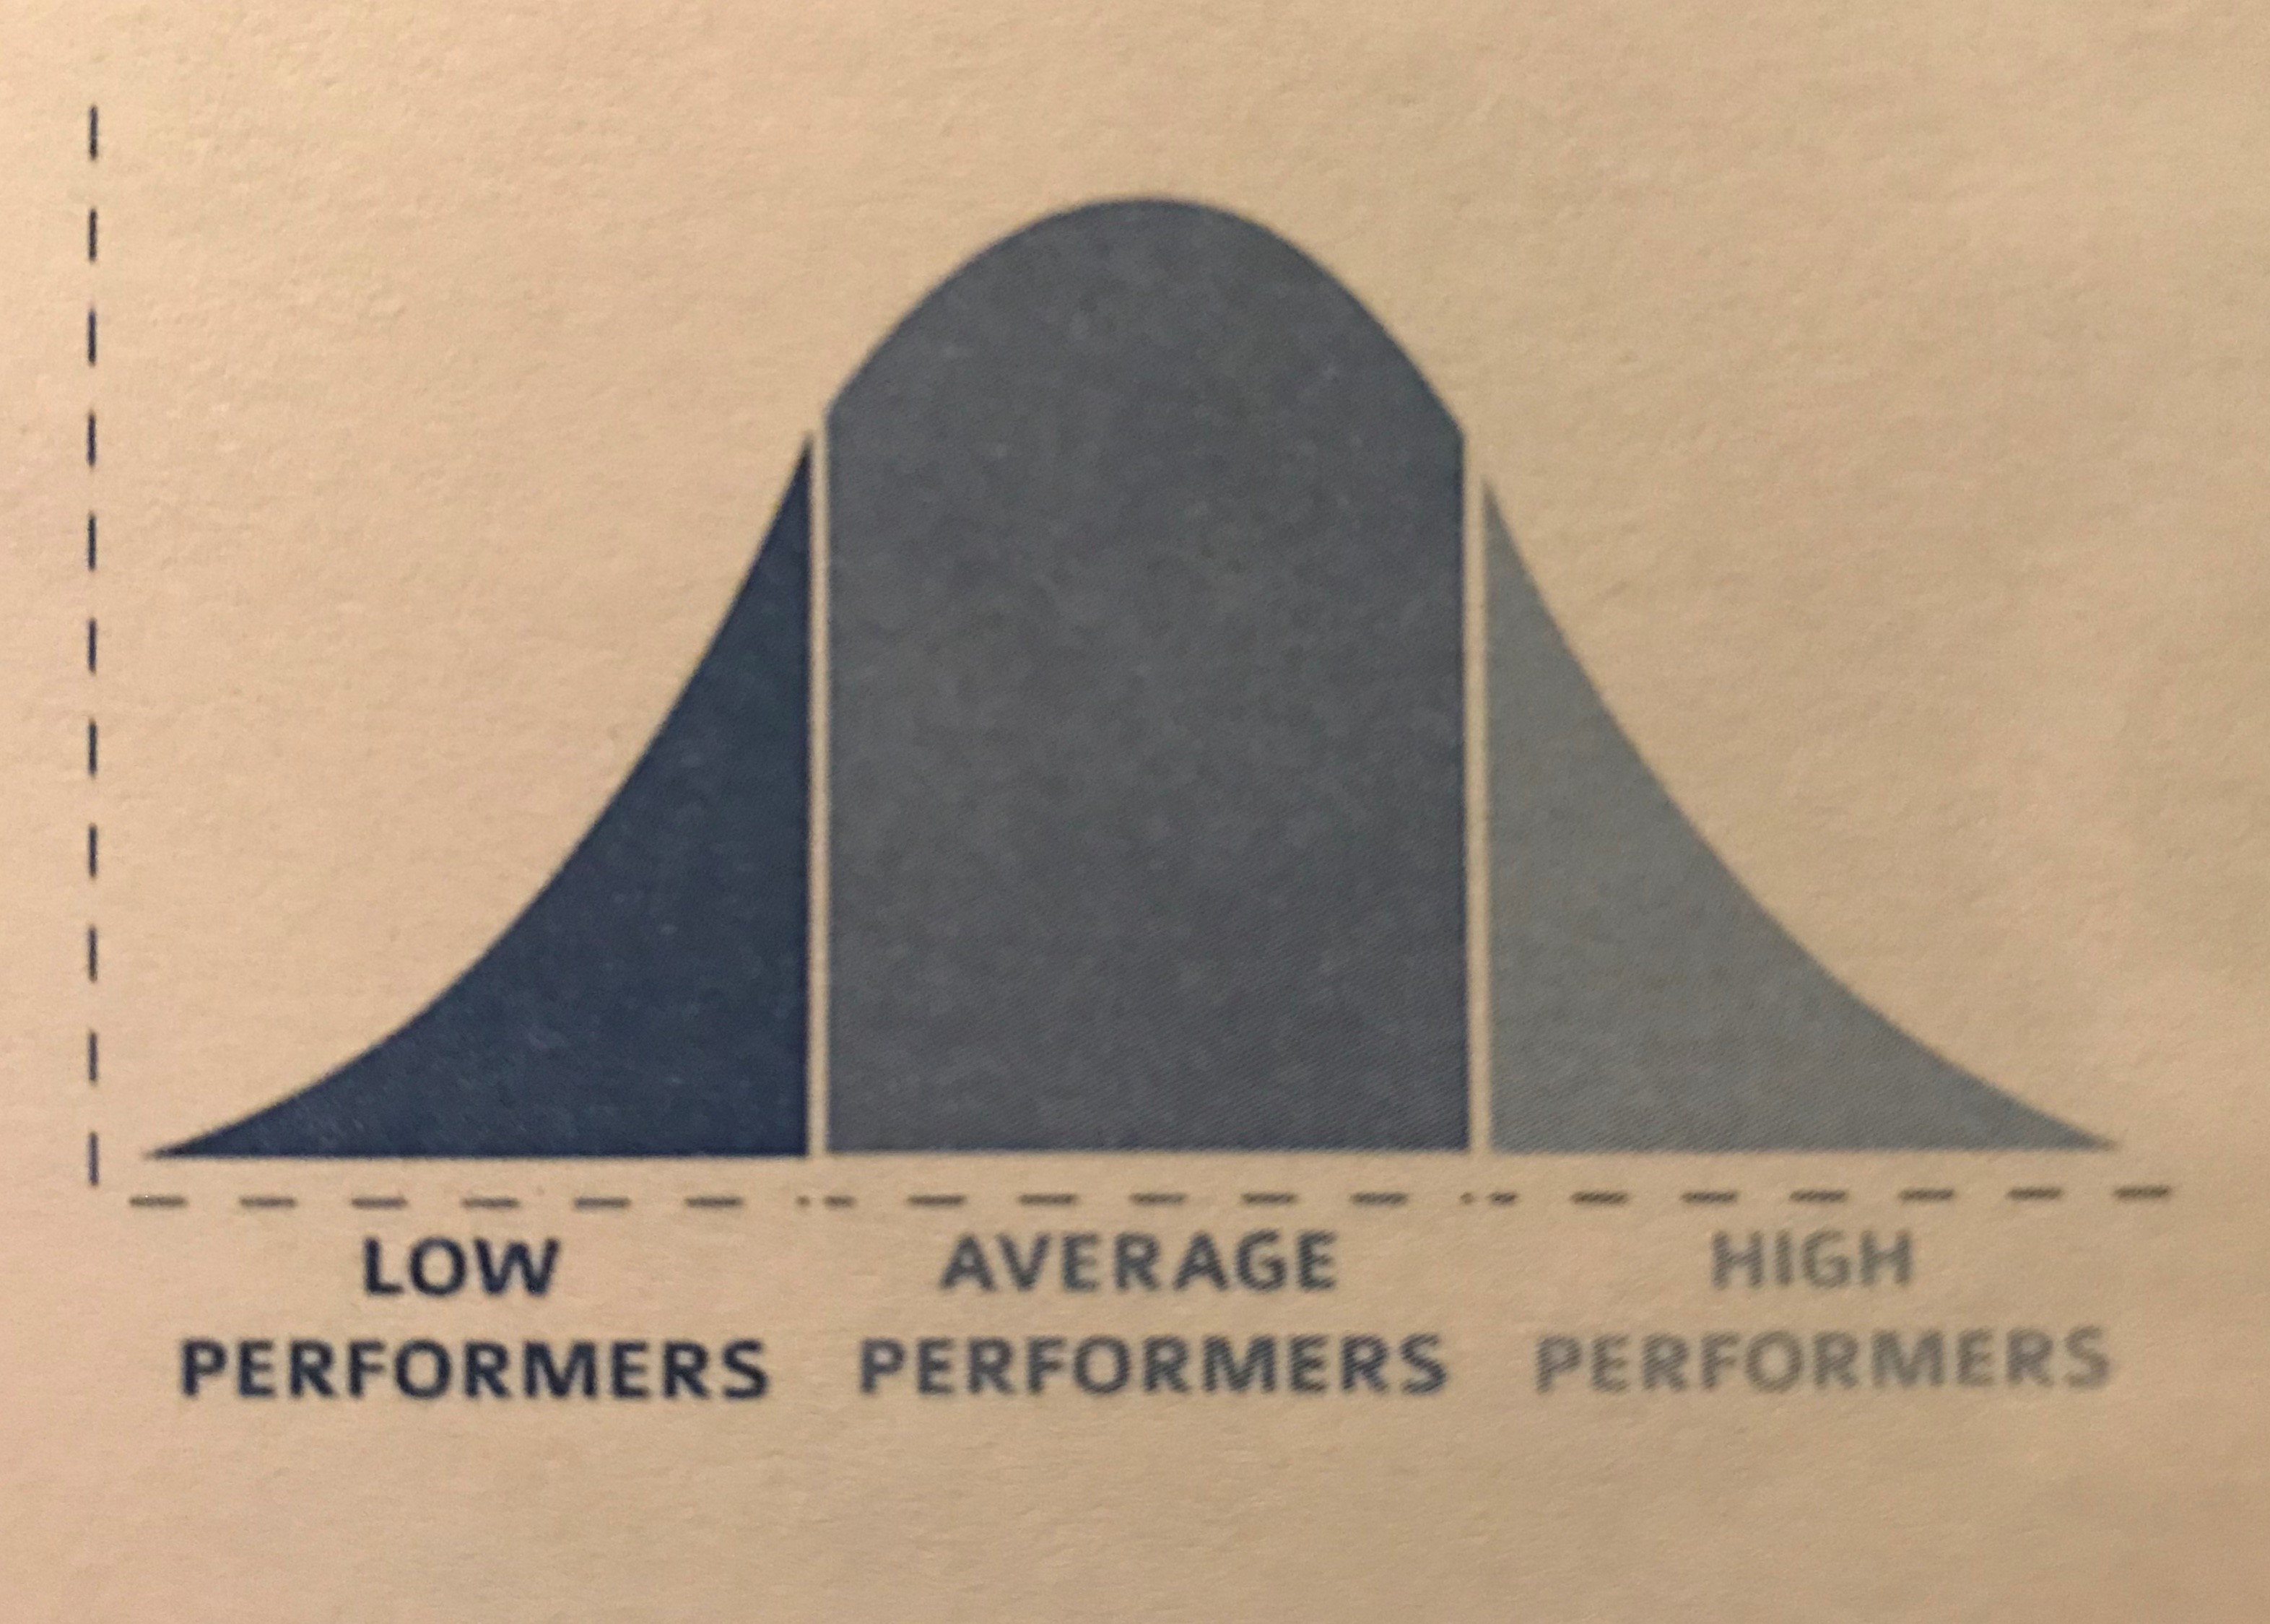
Using the Bell Curve, plot your Low, Average, and High Performing Stores, making note of your High Water Store(s). List your Observations Below.
-
FRANCHISEE(s)
-
WHAT ARE YOUR OBSERVATIONS?
-
WHAT ARE YOUR OBSERVATIONS?
-
FRANCHISEE(s)
-
MARKET(s)
-
FRANCHISEE(s)
-
MARKET(s)
-
FRANCHISEE(s)
-
MARKET(s)
WHY BEST IN CLASS
-
Identify the Best Practices used by your High Watermark to achieve their metrics.
-
WHAT ARE THE BEST PRACTICES?
-
How can you implement them in your Low Performing Stores?
OPPORTUNITY ASSESSMENT
-
Identify the difference between the Average and your High Watermark. if you can move the Average, What impact does that have?
-
WHERE IS THE OPPORTUNITY?
-
CALCULATE: HWM OIL ASP - LOW OIL ASP x NUMBER OF OIL CHANGES = $
-
High Watermark Oil ASP
-
Low Oil ASP
-
Number of Oil Changes
-
HWM OIL ASP - LOW OIL ASP x NUMBER OF OIL CHANGES = $. Impact?

PLAN TO GET STORES TO HIGH-WATER-MARK
-
List the actionable steps needed to improve your Low Average Performing Stores to High Watermarks
-
WHAT IS YOUR ACTION PLAN?


