Title Page
-
Conducted on
-
Prepared by
OBSERVATIONS
-
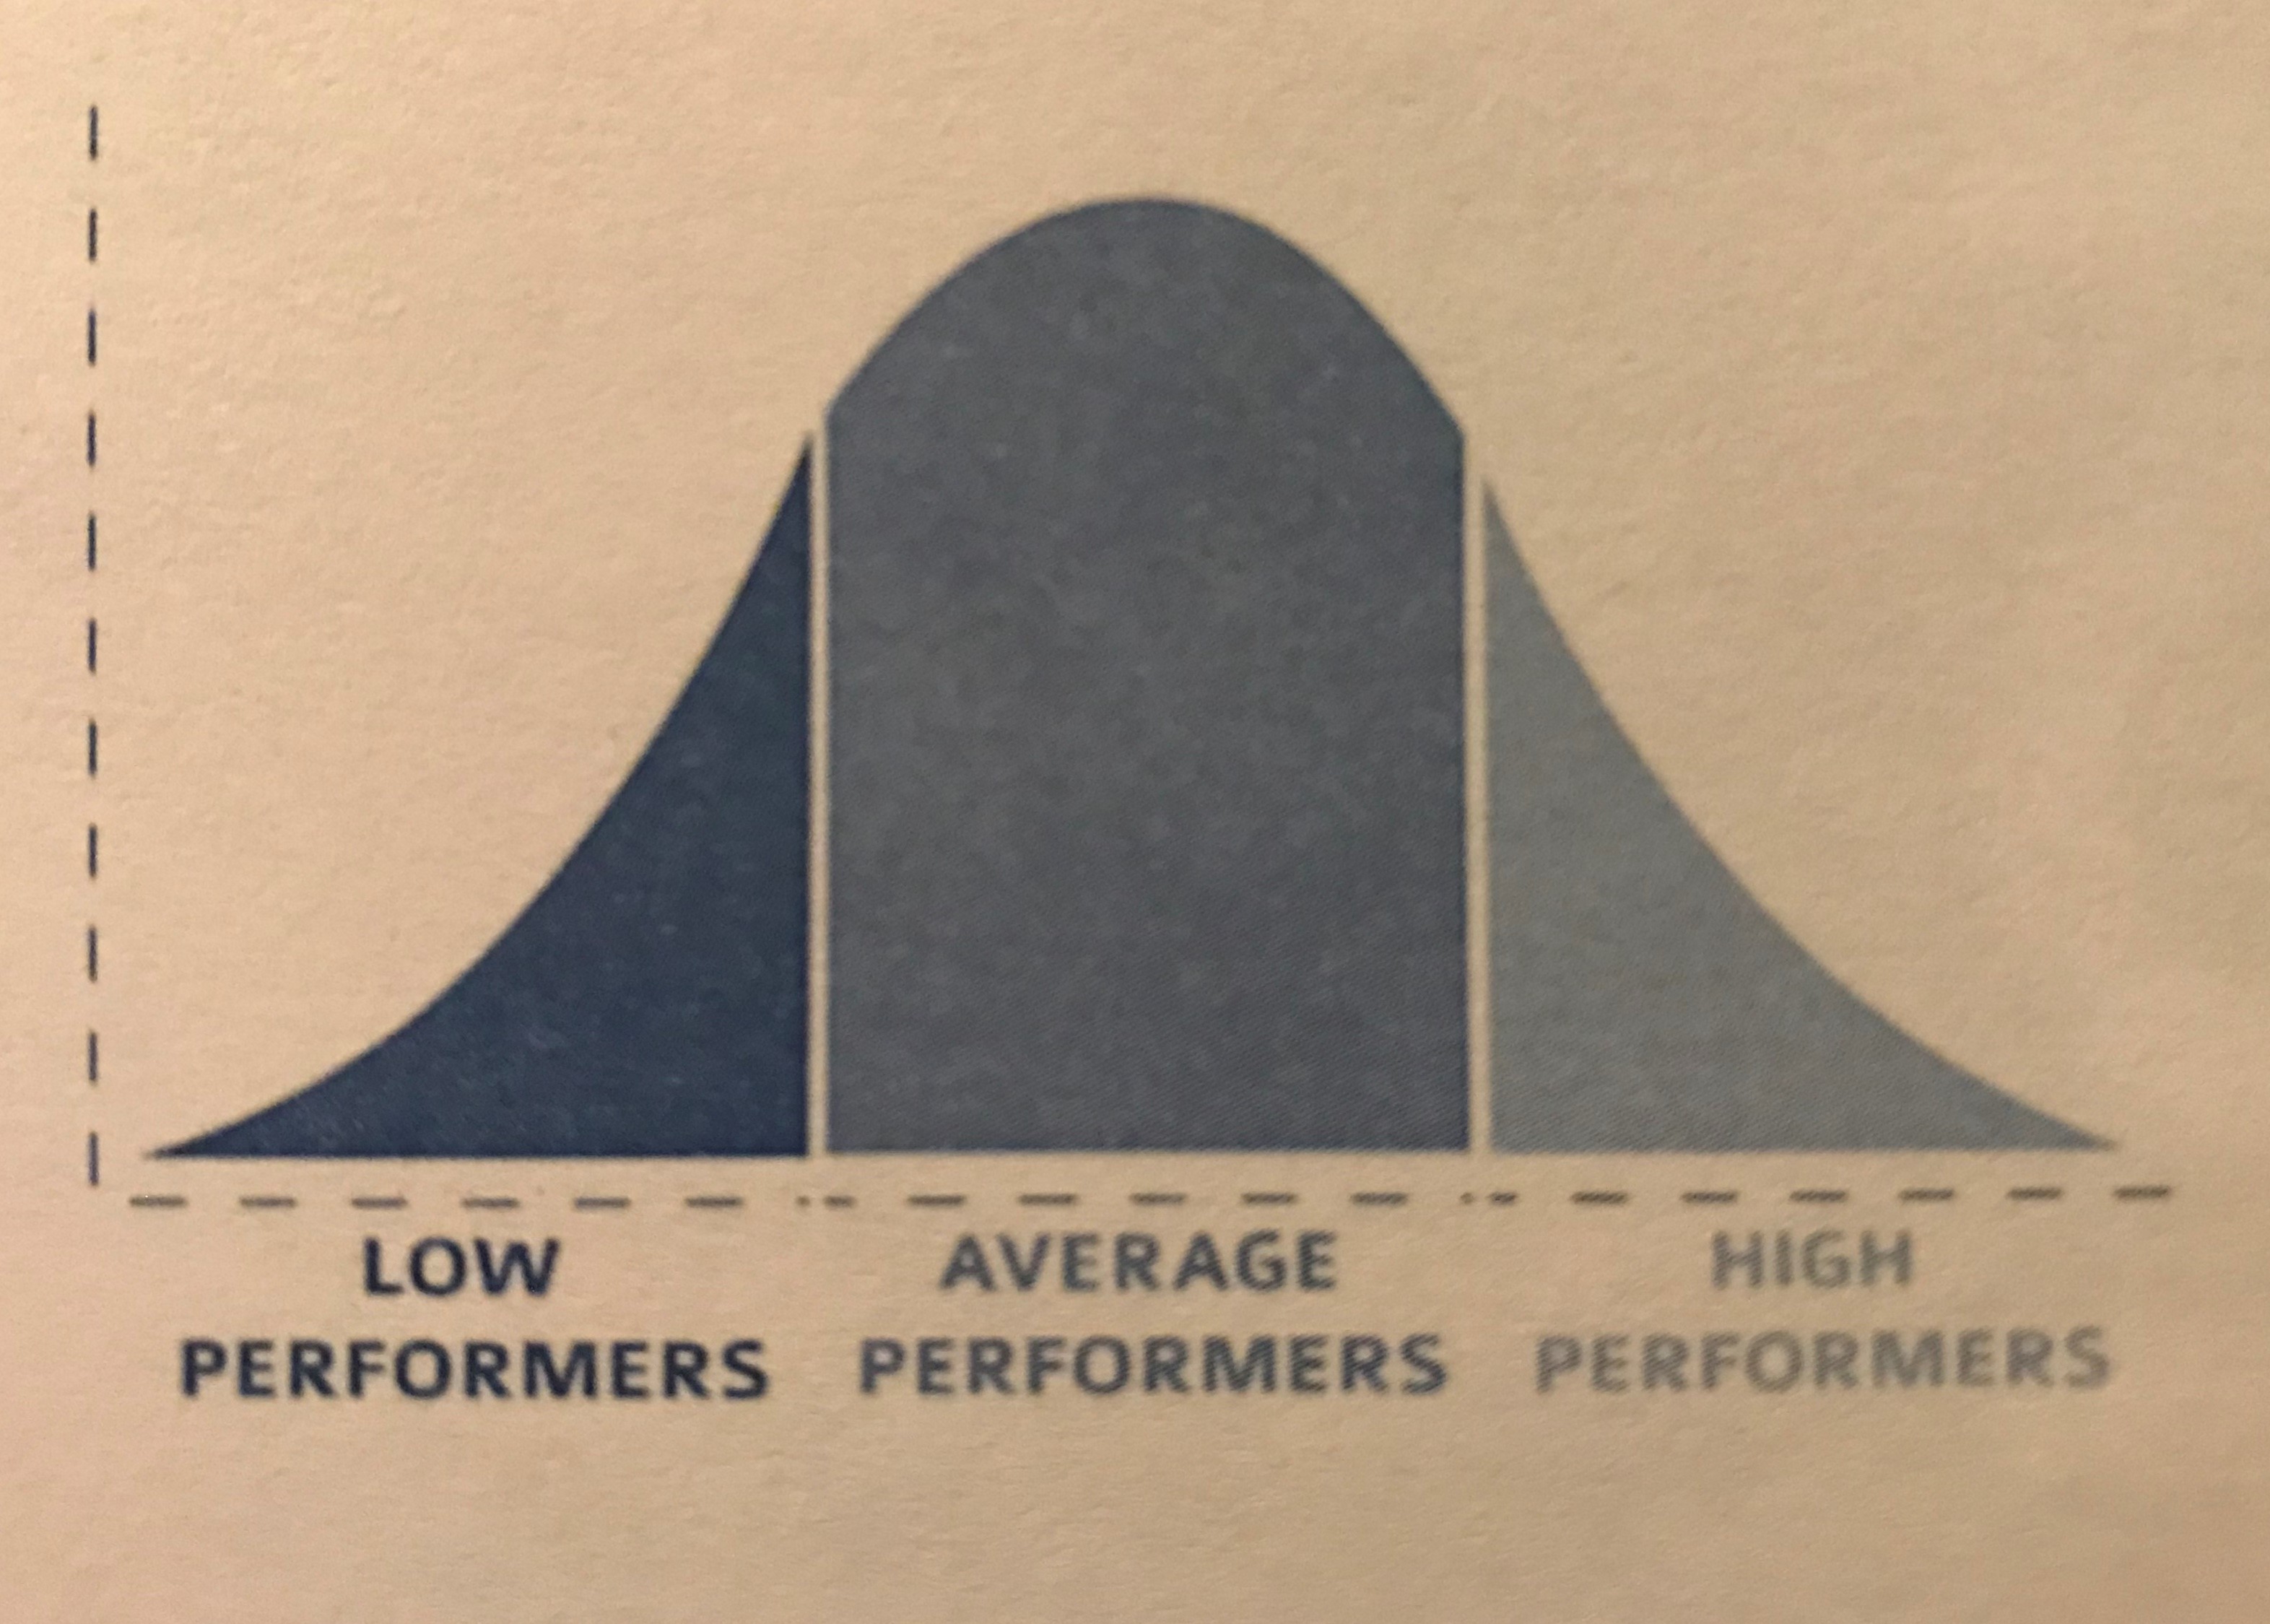
Using the Bell Curve, plot your Low, Average, and High Performing Stores, making note of your High Water Store(s). List your Observations Below.
-
FRANCHISEE(s)
-
WHAT ARE YOUR OBSERVATIONS?
-
WHAT ARE YOUR OBSERVATIONS?
-
FRANCHISEE(s)
-
MARKET(s)
-
FRANCHISEE(s)
-
MARKET(s)
-
FRANCHISEE(s)
-
MARKET(s)
WHY BEST IN CLASS
-
Identify the Best Practices used by your High Watermark to achieve their metrics.
-
WHAT ARE THE BEST PRACTICES?
-
How can you implement them in your Low Performing Stores?
OPPORTUNITY ASSESSMENT
-
Identify the difference between the Average and your High Watermark. if you can move the Average, What impact does that have?
-
WHERE IS THE OPPORTUNITY?
-
CALCULATE: Multiply each Store's Total Payroll Dollars by PP of the High Watermark Store. This will give you the Target $GP
-
Target $GP
-
Subtract each Store's actual $GP from the Target $GP
-
The number you come up with is the "GAP" to the high watermark
-
The "GAP" to the High Watermark
-
This is the starting point! You now need to close the gap!
-
What's the Cause? Is it Margins? Is it Unproductive Payroll? Is it Poor Premium Selling? NOTE: THIS IS THE MOST CRITICAL STEP TO UNDERSTAND.
-
What's the Cause?
-
What Steps can You Take to Close the GAP? How? NOTE: THIS STEP IS WHERE YOU NEED TO COACH THE MANAGERS WHAT'S IN IT FOR THEM.
-
STEPS TO CLOSE THE GAP
PLAN TO GET STORES TO HIGH-WATER-MARK
-
List the actionable steps needed to improve your Low Average Performing Stores to High Watermarks
-
WHAT IS YOUR ACTION PLAN?


